Monitoring Network Slices
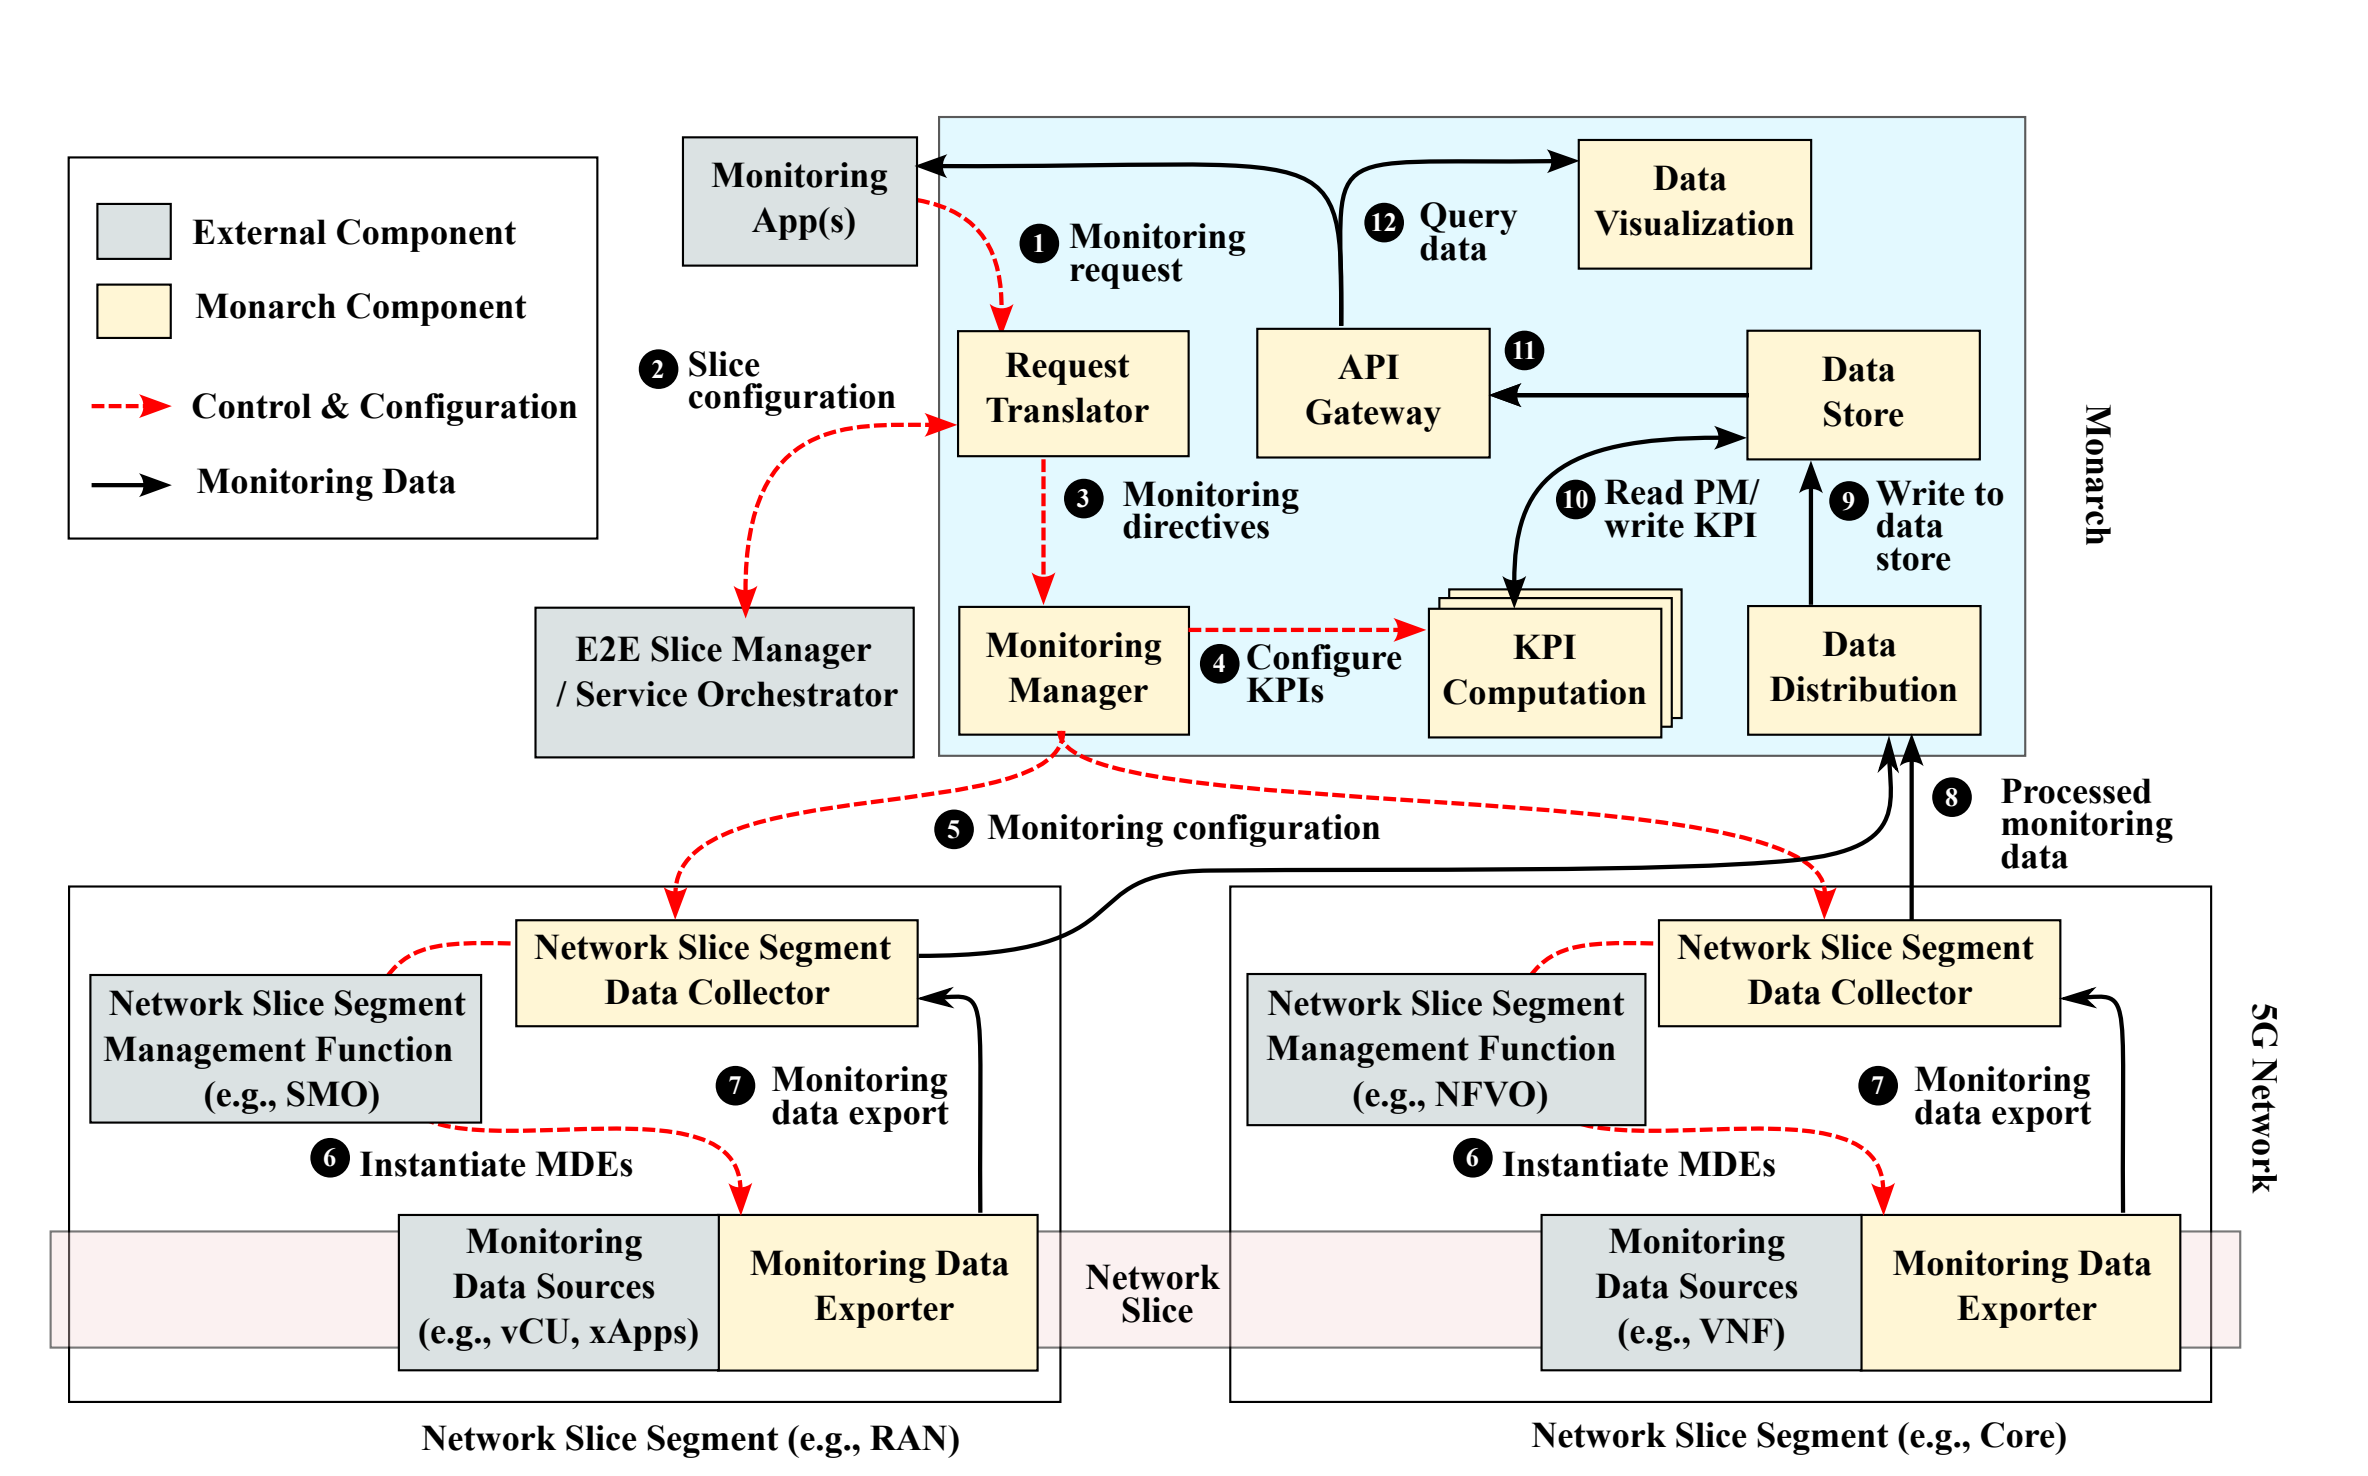
Welcome to the second session of the Rogers Executive Workshop. This session will focus on monitoring network slices using Monarch, a monitoring architecture tailored for cloud-native 5G deployments. Monarch focuses on network slice monitoring and per-slice KPI computation, enabling efficient tracking of slice performance.
The figure below shows the conceptual architecture of Monarch.

1. Setting Up Monitoring Tools
In this section, participants will set up Monarch to enable real-time telemetry collection and monitoring for 5G network slices.
- 1. Install various Monarch components such as Prometheus for collecting and storing metrics data and Grafana for visualizing and analyzing slice performance metrics.
- Configure Monarch for slice-level data collection, e.g., slice throughput.
By the end of this setup, participants will have real-time monitoring for deployed slices.
Slides for this section: Monarch Deployment Slides.
2. Hands-on Monitoring and Telemetry Collection
This hands-on session focuses on using Monarch to monitor slices, observe performance metrics, and derive insights into slice health and efficiency.
- Explore Prometheus and PromQL: Gain hands-on experience with Prometheus, the powerful metrics collection and storage system used in Monarch, and learn how to query and analyze data using PromQL.
- Real-Time Monitoring Exercises:
- Track number of subscribers and CPU usage for NFs.
Slides for this section: Exercises Slides.
Further Reading
For a deeper dive into Monarch, check out the following papers: